Does Irresponsible Web Development Contribute to Global Warming?
- Product Development /
Examining the Impact of Bandwidth Usage on Greenhouse Gas Emissions
Worldwide data usage is growing exponentially as broadband data becomes ubiquitous in many countries. Bandwidth-hungry applications gobble up more resources, and data centers are cropping up all over the world (we certainly see our fair share here in Oregon). It’s becoming more visible that the world’s data addictiveness has an increasing impact on power consumption. While concerted efforts are being made to make server farms more energy efficient, one part of the equation falls directly on our shoulders as web and mobile application innovators: how can we reduce the amount of data that’s required to be transmitted, and what impact can we make on the environment?
To find the impact of the world’s data consumption on the environment, we set out to collect a few different data points that would help us build a more complete picture:
- How much electricity does it take to transfer data?
- How many greenhouse gas emissions does that amount of electricity produce?
- Finally, how much greenhouse gas does one GB of data transfer produce?
As we expected there are no black and white answers to these questions, but there are some estimates that we can work off of. According to the American Council for an Energy-Efficient Economy it takes 5.12 kWh of electricity per gigabyte of transferred data. And according to the Department of Energy the average US power plant expends 600 grams of carbon dioxide for every kWh generated. That means that transferring 1GB of data produces 3kg of CO2.
Let that settle in for a moment.
Each GB of data you download results in 3kg of CO2 emissions.
Each hour of Netflix you watch in HD results in almost 10 kg of CO2 emissions just for bandwidth used.
Recently there has been more attention on how modern websites are driving up bandwidth usage irresponsibly. For example, loading the homepage of CNN comes with a data payload of 4MB (the compressed HTML page itself is only 25KB). In our own experiment we were able to optimize their homepage down to 1.5MB. Taking into consideration that as of today CNN.com has 70 million visits a month the 2.5MB of inefficient data leads to 175 terabytes of additional, potentially unneeded data transfer per month. When converting this to CO2 it becomes clear that CNN’s irresponsible website structure results in the creation of over 525 metric tons of CO2 emissions per month. That’s more CO2 than 1,300 passenger vehicles generate in the same time period. And that’s just one website!
The scale of this impact is enormous when extracted across the entire web. So what can we as designers and developers do to reduce that impact?
- Consider bandwidth implications when designing an experience: design for SVG and CSS use, plan on lazy-loading assets, limit the number of different font styles, and so on.
- Start caring about optimization again. The explosion of available bandwidth has made some developers lazy. Whereas load size optimization used to be a skill every developer needed to hone, disregard for bandwidth usage can go unnoticed today. Google PageSpeed provides a good starting point for analyzing your site.
- Ad producers and ad networks need to step up their game in optimizing their content and delivery mechanisms. A recent university study estimated that a simple Ad Blocker can reduce the amount of bandwidth by at least 25%.
More than anything else, though, excessive bandwidth usage should be thought of as wasting a limited resource that has an environmental impact—just like letting the faucet run or your car’s engine idle. The larger your property’s audience, the more responsibility you bear to optimize for bandwidth savings and reduce your carbon footprint.
Note: There are many conflicting power and emissions estimates available, and we chose the ones in this post because they were well publicized. The real impacts might be higher or lower. The goal here is not necessarily to calculate an exact scientific result but to inspire a conversation that should be had even if the numbers can fluctuate in either direction. Based on feedback I have changed the source for the kWh/GB estimate from AT Kearney to ACEEE.
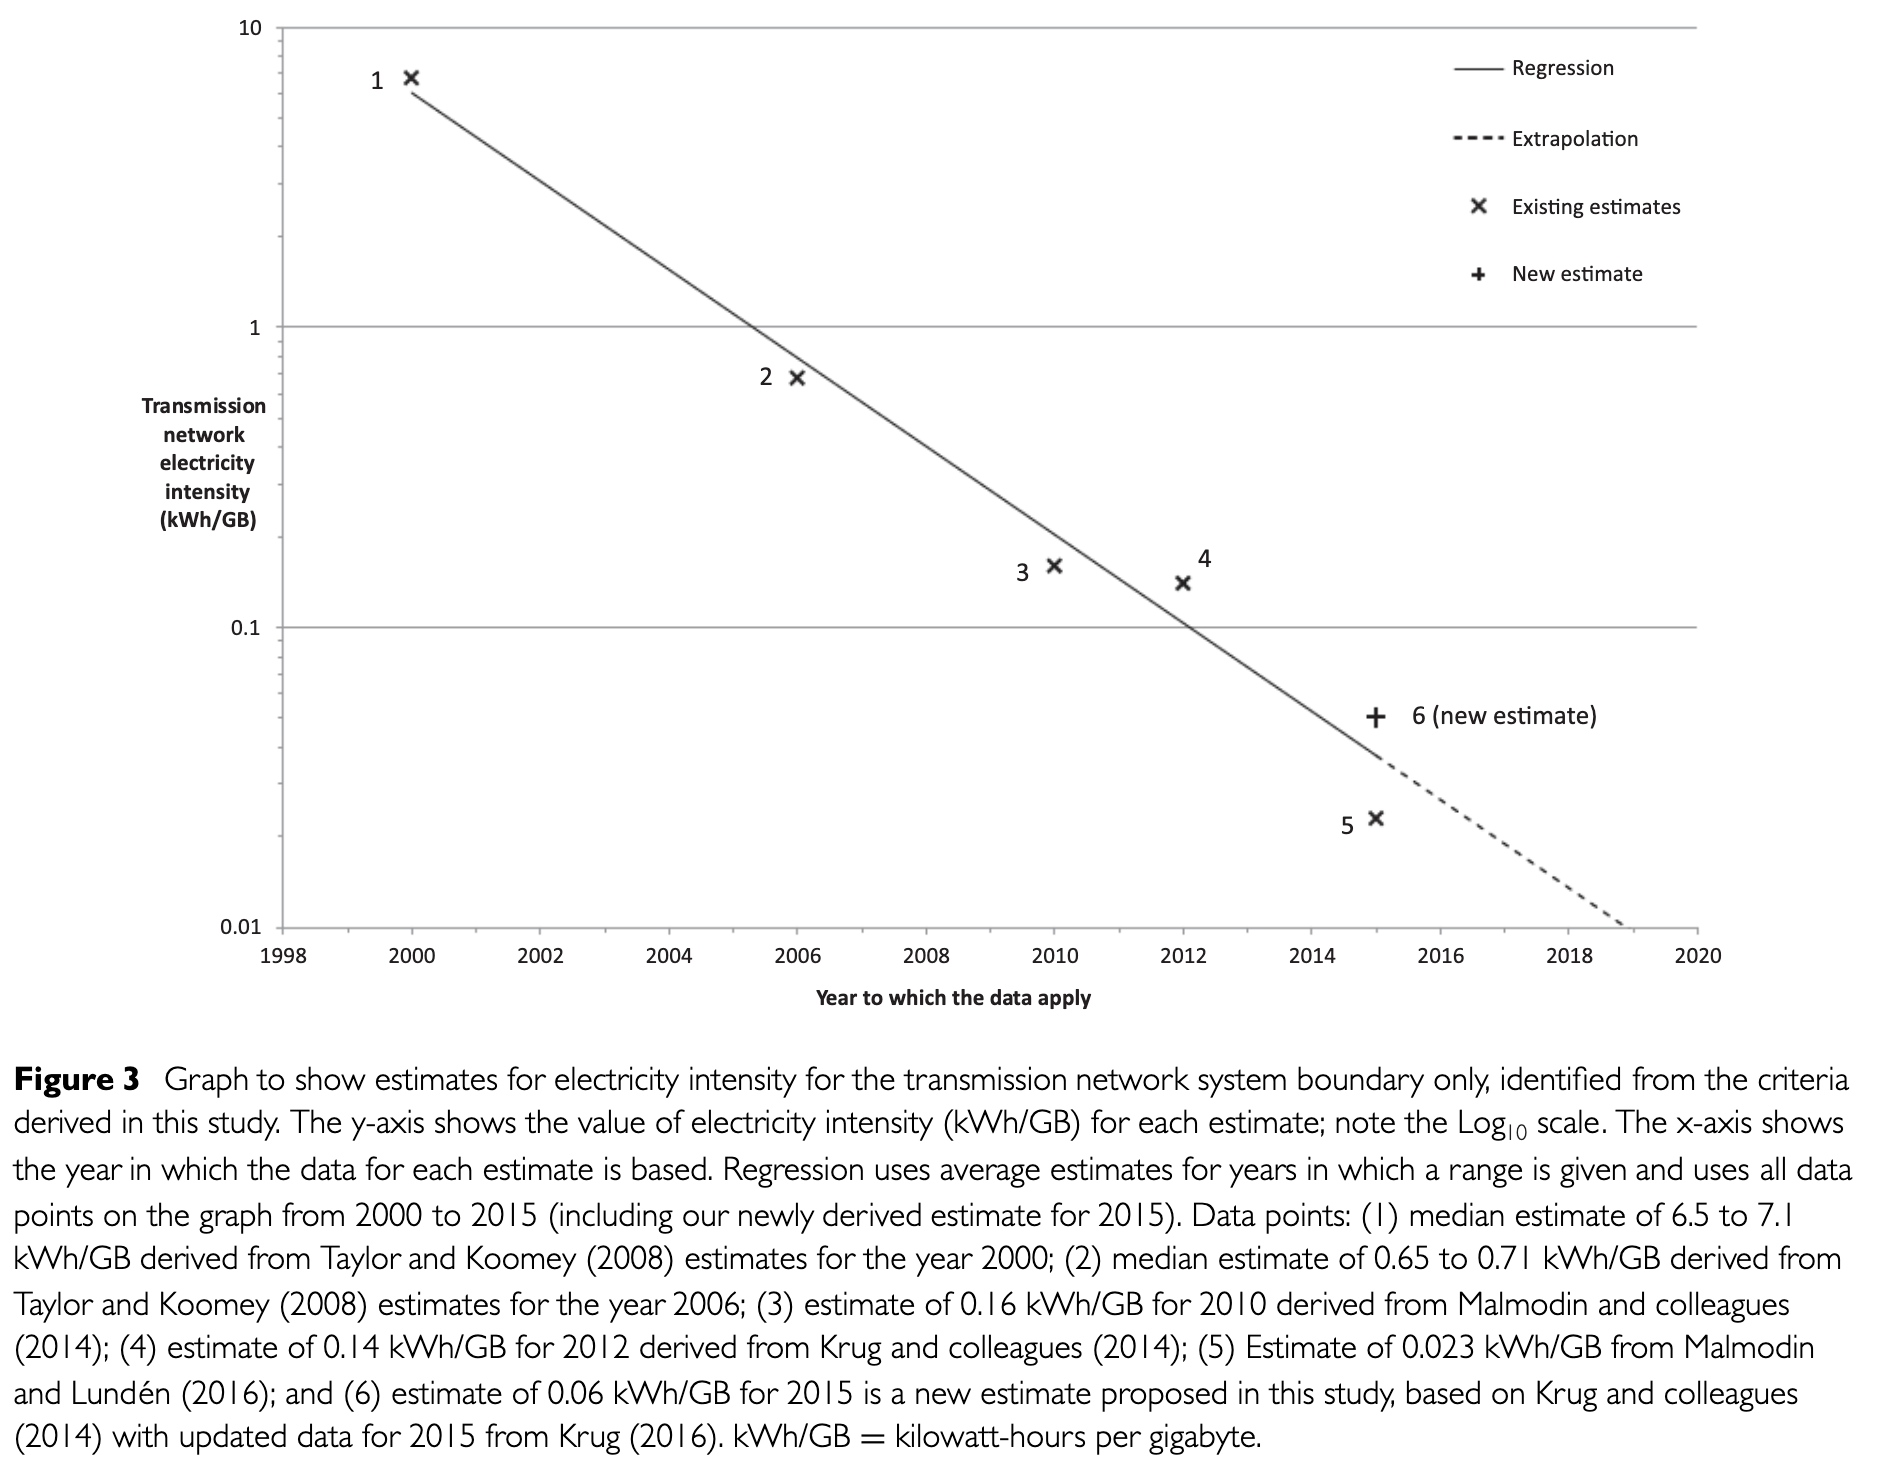
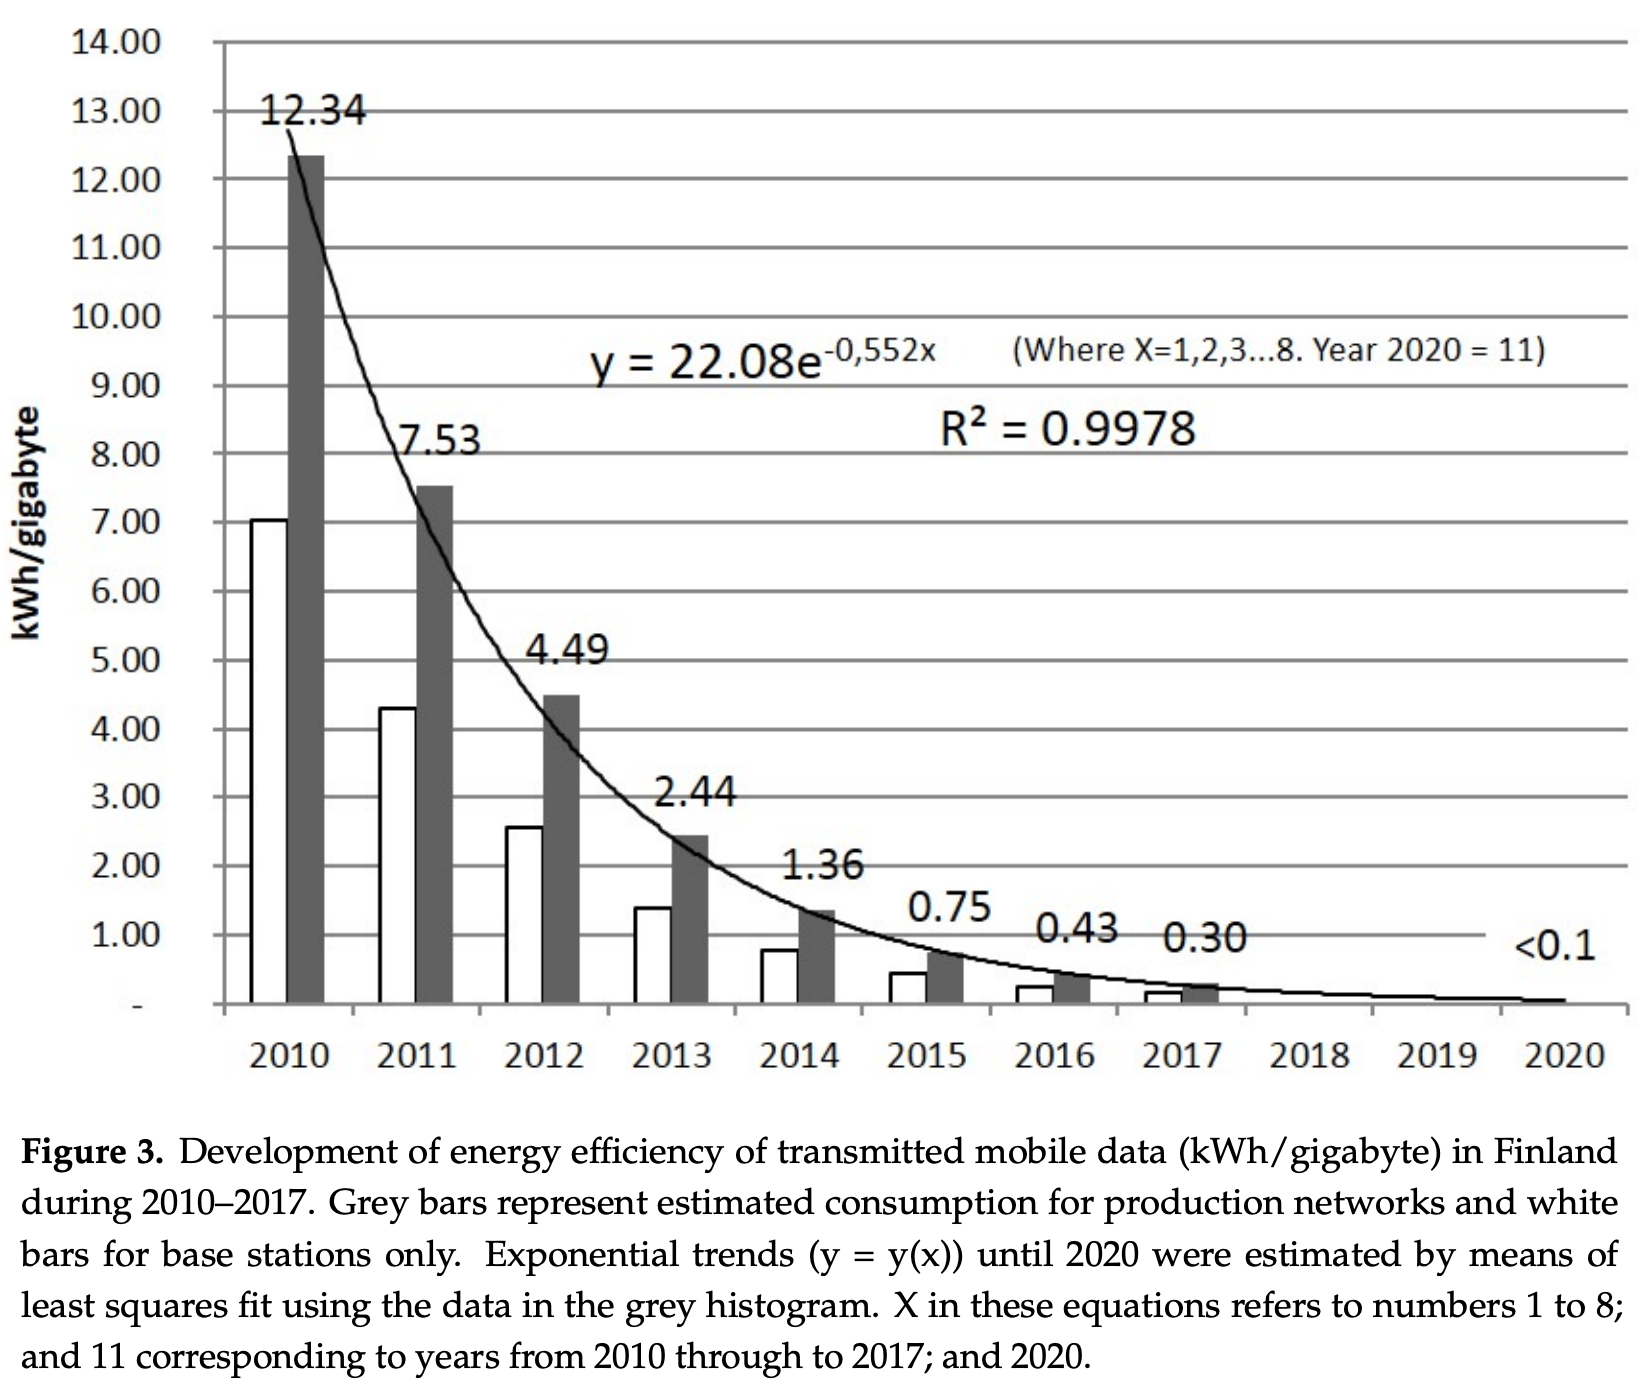
June 2020 update: Since I originally wrote this article in 2016, technological advances have made bandwidth usage more effective, therefore reducing the electricity intensity of internet data transmission. While we haven’t seen any new estimates for kWh/GB in the last couple of years, a Yale University study from 2017 explores the variances in electricity intensity estimates over time. This study, as well as a Finnish study, lay out the consistent decrease in kWh/GB leading up to the year 2020.


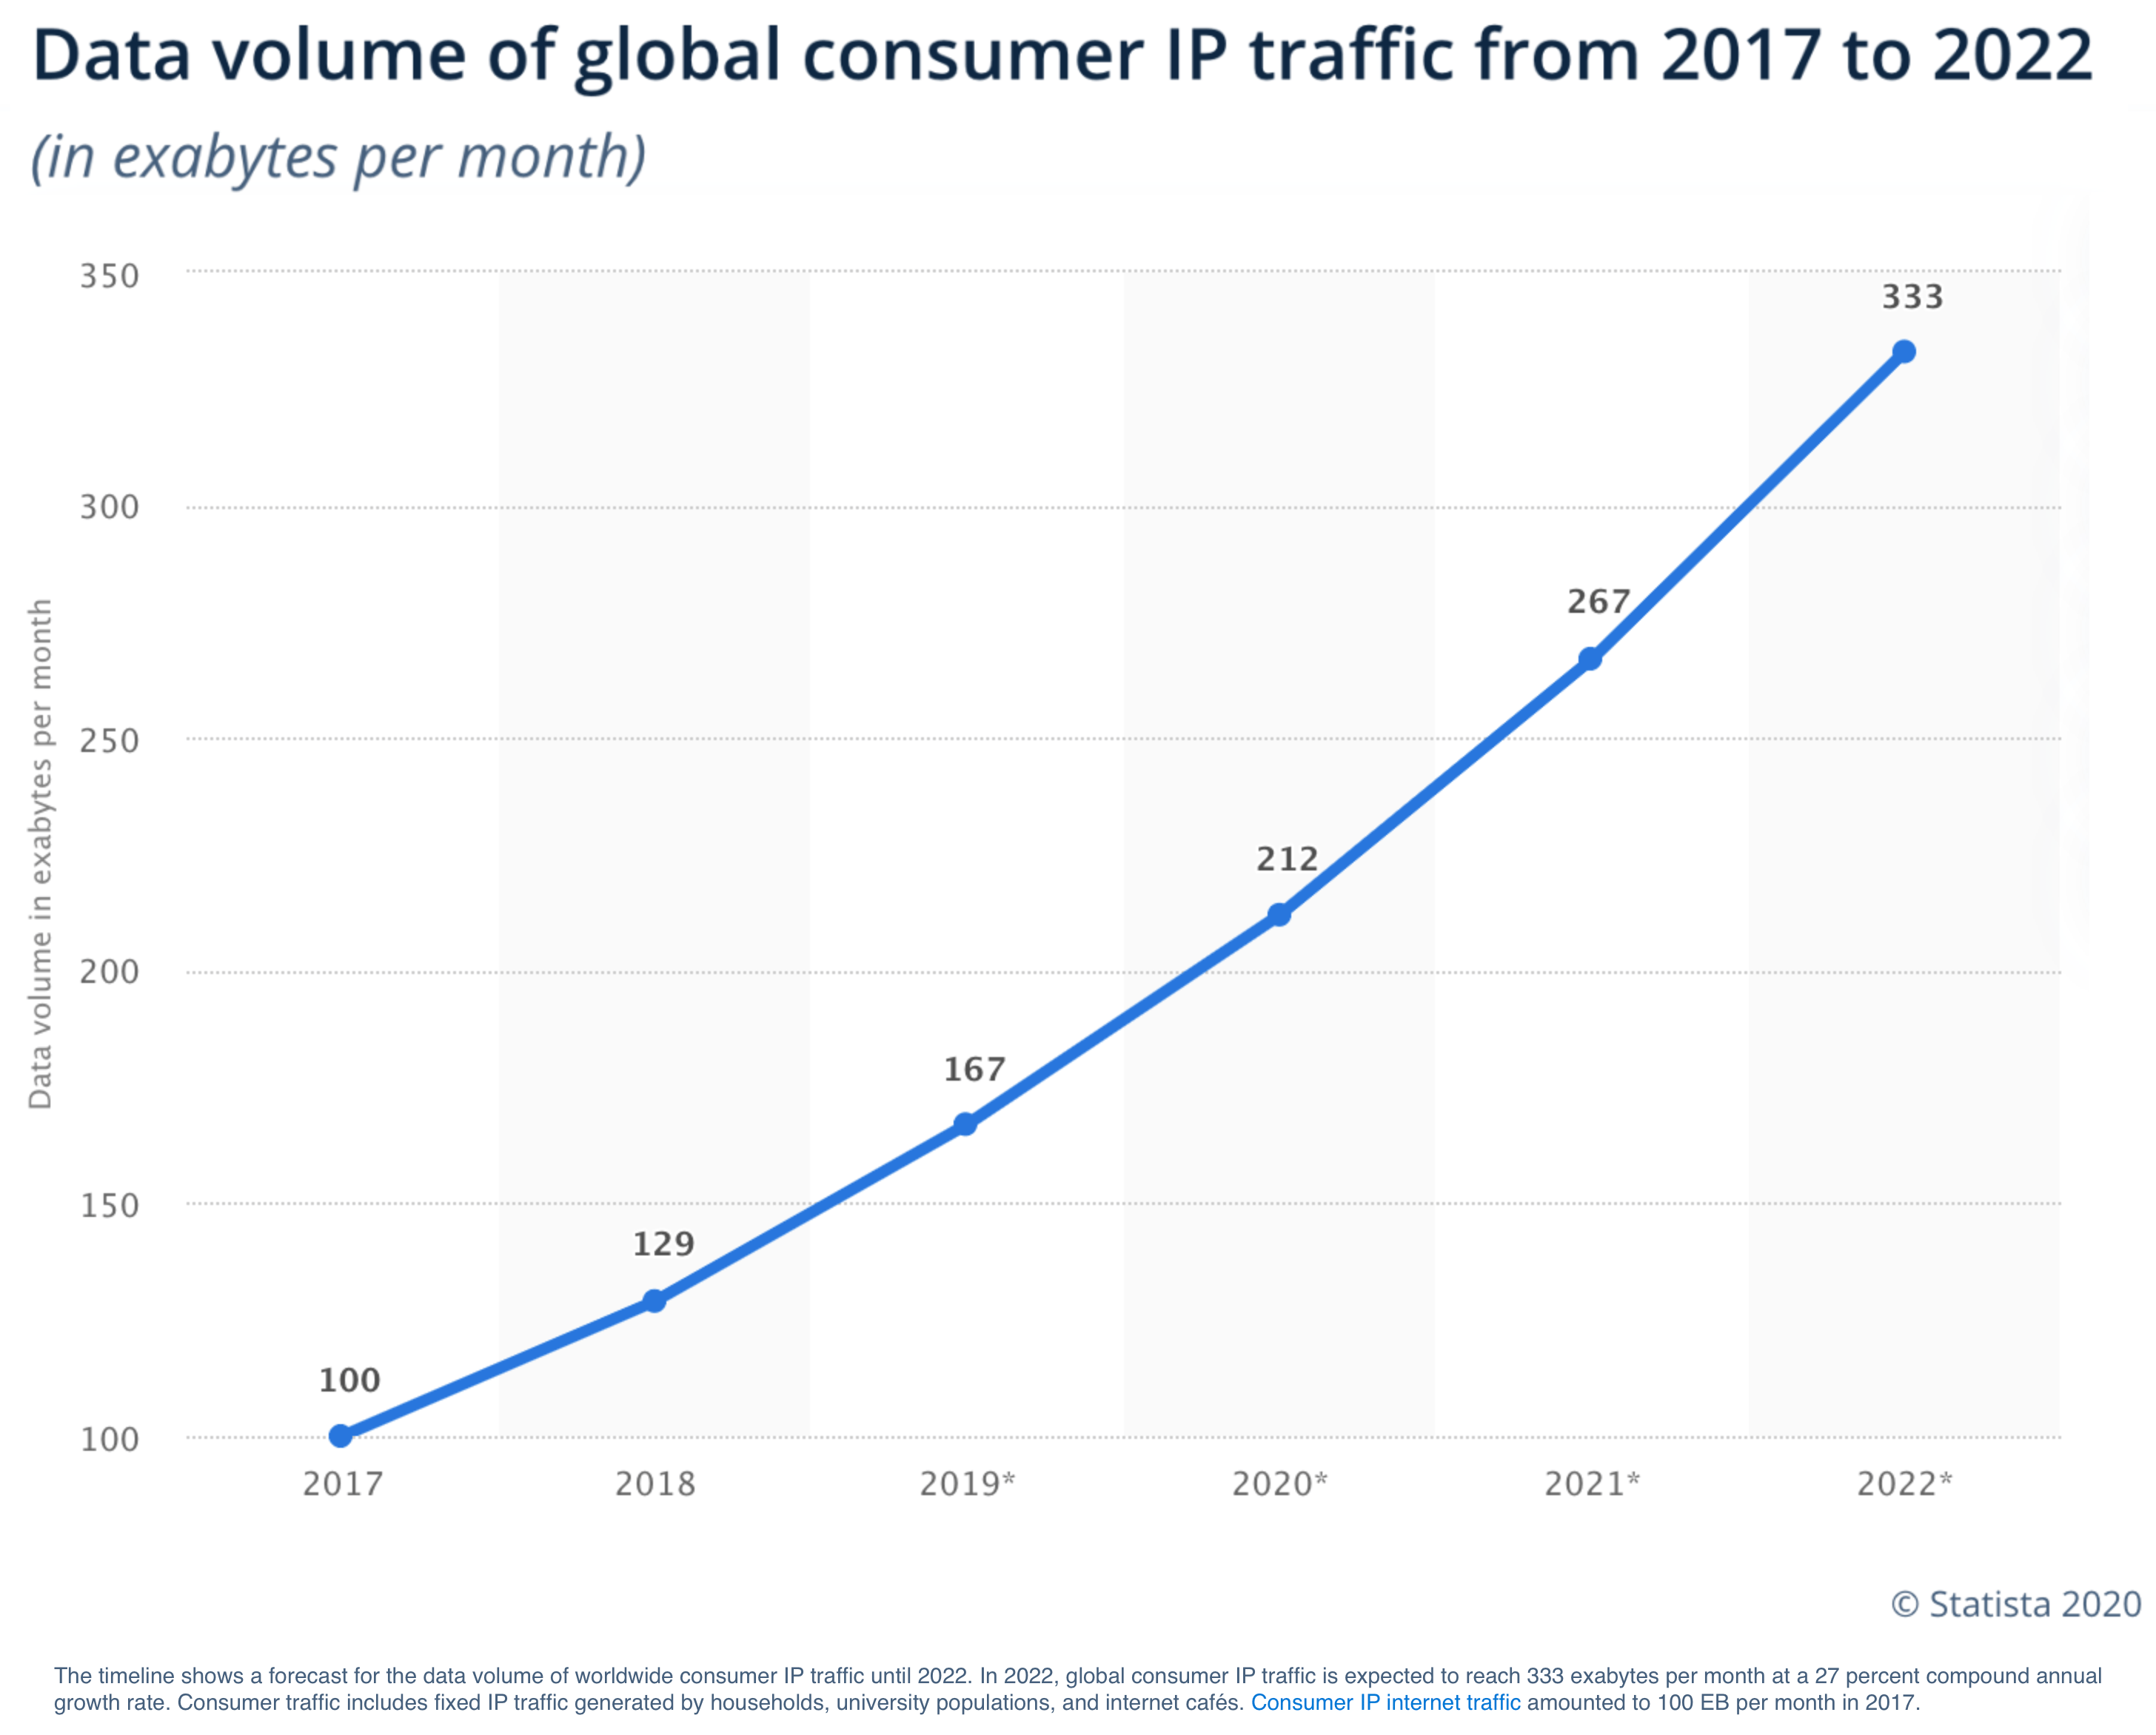
While this certainly is good news, we’ve also seen a steady increase in bandwidth usage globally. This likely is negating some of the progress made through gains on bandwidth energy efficiency.

I believe the principles outlined in this article are as relevant today as they were in 2016. As product creators on the internet, our contributions to data efficiency can make a real difference in global carbon emissions.